ここでは、matplotlib colorbarのlabelのいろいろな操作方法について紹介します。
matplotlibのバージョンは3.3.3 です。colorbar()ドキュメント日本語訳や、他のFAQもあわせて参考にしてみてくださいね。
- Figure.colorbar() / pyplot.colorbar() – matplotlibドキュメント日本語訳
- colorbar.ColorbarBaseクラス – matplotlibドキュメント日本語訳
- matplotlibのcolorbarを図と同じサイズにする方法。
目次
下準備
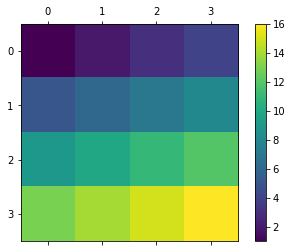
次のようなcolorbarを付与したマップに対してラベル操作をしていきます。例はオブジェクト指向スタイルですが、colorbarはpyplotスタイルでも同様に扱えます。
import matplotlib.pyplot as plt

dat = [[1,2,3,4,],
       [5,6,7,8,],
       [9,10,11,12,],
       [13,14,15,16,],]
fig, ax = plt.subplots()
aximg = ax.matshow(dat)

fig.colorbar(aximg, ax=ax)
plt.show()
colorbarにラベル(label)を表示する
colorbarにラベル(例: ‘foobar’)を表示するには、colorbarを作成する際に、colorbarメソッドに次のようにlabelパラメータを渡します。
colorbar(mappable, ax=ax, label='foobar')
もう一つの方法としては、colorbarBaseの公開メソッドであるset_label()を使います。
colorbar(mappable, ax=ax).set_label('foobar')
colorbar()は返り値にColorbarを返します。
これは、オブジェクト指向スタイルのfigure.Figure.colorbar()でも、pyplotスタイルのpyplot.colorbar()でも同様です。
例
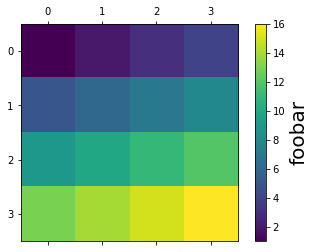
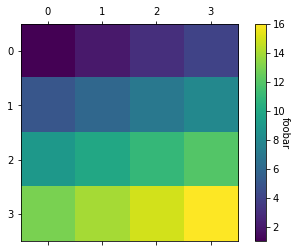
colorbarに’foobar’というラベルをセットします。
import matplotlib.pyplot as plt

dat = [[1,2,3,4,],
       [5,6,7,8,],
       [9,10,11,12,],
       [13,14,15,16,],]
fig, ax = plt.subplots()
aximg = ax.matshow(dat)

fig.colorbar(aximg, ax=ax, label='foobar') #'foobar'というラベルをセット
#fig.colorbar(aximg, ax=ax).set_label('foobar') #これでも可
plt.show()

ラベルが表示されました。
colorbarラベルのフォントサイズ(font size)
colorbar ラベルのフォントサイズを変更するには、colorbarのset_label()メソッドに、次のようにパラメータsizeかfontsizeを渡します。
colorbar(mappable, ax=ax).set_label('foobar', size=20)
# colorbar(mappable, ax=ax).set_label('foobar', fontsize=20) #これでも可
フォントサイズには、浮動小数点のほか、’large’なども使えます。
fontsize or size: float or {‘xx-small’, ‘x-small’, ‘small’, ‘medium’, ‘large’, ‘x-large’, ‘xx-large’}
他の方法としては、次のようにパラメータfontdictとして辞書形式のフォントスタイルを渡すことでも、フォントサイズを変更できます。
colorbar(mappable, ax=ax).set_label('foobar', fontdict={'size' : 20})
あるいは、rcParamsを変更すると、colorbarのラベルを含めて、他のラベルも一括してフォントサイズを変更することができます。colorbarでフォントサイズが指定されている場合はそちらが優先されます。
plt.rcParams['axes.labelsize'] = 10 #ラベル全体のフォントサイズ
plt.rcParams['font.size'] = 10 #全体のフォントサイズ
例
ラベルのフォントサイズを20ポイントにします。
import matplotlib.pyplot as plt

dat = [[1,2,3,4,],
       [5,6,7,8,],
       [9,10,11,12,],
       [13,14,15,16,],]
fig, ax = plt.subplots()
aximg = ax.matshow(dat)

cb = fig.colorbar(aximg, ax=ax)
cb.set_label('foobar', size=20) #ラベルサイズを20ポイントにする

plt.show()
ラベルのフォントサイズが大きくなりました。
colorbarラベルの文字色・背景色 (label color)
colorbar ラベルの文字色を変更するには、colorbarのset_label()メソッドに、次のようにパラメータcolorまたはcを渡します。
colorbar(mappable, ax=ax).set_label('foobar', color='r') #赤色にする
# colorbar(mappable, ax=ax).set_label('foobar', c='r') #これでも可
背景色はbackgroundcolorパラメータで指定します。
colorbar(mappable, ax=ax).set_label('foobar', backgroundcolor='r') #背景を赤色にする
色指定方法は、浮動小数点または8進数でRGBかRGBA表記する、色名またはその短縮表記{‘b’, ‘g’, ‘r’, ‘c’, ‘m’, ‘y’, ‘k’, ‘w’}を書くなどの方法があります。
Matplotlib recognizes the following formats to specify a color:
- an RGB or RGBA (red, green, blue, alpha) tuple of float values in closed interval
[0, 1](e.g.,(0.1, 0.2, 0.5)or(0.1, 0.2, 0.5, 0.3));- a hex RGB or RGBA string (e.g.,
'#0f0f0f'or'#0f0f0f80'; case-insensitive);- a shorthand hex RGB or RGBA string, equivalent to the hex RGB or RGBA string obtained by duplicating each character, (e.g.,
'#abc', equivalent to'#aabbcc', or'#abcd', equivalent to'#aabbccdd'; case-insensitive);- a string representation of a float value in
[0, 1]inclusive for gray level (e.g.,'0.5');- one of the characters
{'b', 'g', 'r', 'c', 'm', 'y', 'k', 'w'}, which are short-hand notations for shades of blue, green, red, cyan, magenta, yellow, black, and white. Note that the colors'g', 'c', 'm', 'y'do not coincide with the X11/CSS4 colors. Their particular shades were chosen for better visibility of colored lines against typical backgrounds.- a X11/CSS4 color name (case-insensitive);
- a name from the xkcd color survey, prefixed with
'xkcd:'(e.g.,'xkcd:sky blue'; case insensitive);- one of the Tableau Colors from the ‘T10’ categorical palette (the default color cycle):
{'tab:blue', 'tab:orange', 'tab:green', 'tab:red', 'tab:purple', 'tab:brown', 'tab:pink', 'tab:gray', 'tab:olive', 'tab:cyan'}(case-insensitive);- a “CN” color spec, i.e. ‘C’ followed by a number, which is an index into the default property cycle (
rcParams["axes.prop_cycle"](default:cycler('color', ['#1f77b4', '#ff7f0e', '#2ca02c', '#d62728', '#9467bd', '#8c564b', '#e377c2', '#7f7f7f', '#bcbd22', '#17becf']))); the indexing is intended to occur at rendering time, and defaults to black if the cycle does not include color.
fontdictにスタイルを渡す方法も使えます。
colorbar(mappable, ax=ax).set_label('foobar', fontdict={'color' : 'r'})
例
ラベル色を赤色にします。
import matplotlib.pyplot as plt

dat = [[1,2,3,4,],
       [5,6,7,8,],
       [9,10,11,12,],
       [13,14,15,16,],]
fig, ax = plt.subplots()
aximg = ax.matshow(dat)

cb = fig.colorbar(aximg, ax=ax)
cb.set_label('foobar', c='r') #ラベル文字色を赤にする。
cb.set_label('foobar', fontdict={'color' : '#a33'}) #これでも可

plt.show()
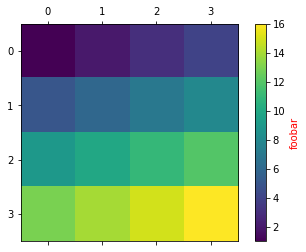
ラベル色が赤色になりました。
colorbarのラベル位置 (position, location)
colorbarのラベル位置を変えたい場合には、yパラメータを渡します。
colorbar(mappable, ax=ax).set_label('foobar', y=1)
positionを使って次のようにもできます。
colorbar(mappable, ax=ax).set_label('foobar', position=(0,1))
ラベルとtickラベルの間隔をあけたい場合には、次の項「ラベルパディング」を参照してください。
matplotlibのversionが3.3.0以降であれば、locパラメータも使えます。
colorbar(mappable, ax=ax).set_label('foobar', loc='top')
loc{‘bottom’, ‘center’, ‘top’}, default:
rcParams["xaxis.labellocation"](default:'center')The label position. This is a high-level alternative for passing parameters x and horizontalalignment.
locパラメータが対応していないバージョンで使った場合には、’Text’ object has no property ‘loc’というエラーが出ます。matplotlibのバージョンは次のようにして確認します。
import matplotlib
matplotlib.__version__
matplotlibのバージョンを3.3.3などに指定してインストールするには次のようにします。google colabolatoryではこのコマンドでインストールすれば、最新のバージョンも使えますね。
!pip install matplotlib==3.3.3
例
ラベルを上端に移動します。
import matplotlib.pyplot as plt

dat = [[1,2,3,4,],
       [5,6,7,8,],
       [9,10,11,12,],
       [13,14,15,16,],]
fig, ax = plt.subplots()
aximg = ax.matshow(dat)

cb = fig.colorbar(aximg, ax=ax)
cb.set_label('foobar', y=1) #ラベルを上端に移動
#cb.set_label('foobar', loc='top') #version 3.3.0以降なら、これも可
plt.show()
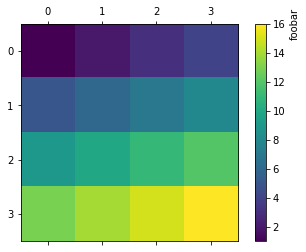
ラベル位置が移動しました。
colorbarのラベルパディング/スペーシング (labelpad)
colorbarのラベルとtickがぶつかっているなどして、ラベルの間隔をあけたい場合には、labelpadパラメータをポイント単位で渡します。
colorbar(mappable, ax=ax).set_label('foobar', labelpad=10)
labelpad: float, default: None
Spacing in points from the axes bounding box including ticks and tick labels.
例
colorbarのtickラベルとラベルの間に100ポイントの余白をあけます。
import matplotlib.pyplot as plt

dat = [[1,2,3,4,],
       [5,6,7,8,],
       [9,10,11,12,],
       [13,14,15,16,],]
fig, ax = plt.subplots()
aximg = ax.matshow(dat)

fig.colorbar(aximg, ax=ax).set_label('foobar', labelpad=100)

plt.show()
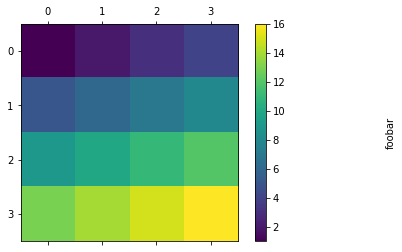
余白があきました。
colorbarのラベル回転 (rotation)
回転するには、colorbar.set_label()にrotationパラメータを渡します。回転角は、度(deg.)で指定します。xの正方向を0度として、反時計回りに数えます。
colorbar(mappable, ax=ax).set_label('foobar', rotation=270)
90度がデフォルト状態です。0度だと水平です。270度でデフォルトから反転します。
例
ラベルを反転する。
import matplotlib.pyplot as plt

dat = [[1,2,3,4,],
       [5,6,7,8,],
       [9,10,11,12,],
       [13,14,15,16,],]
fig, ax = plt.subplots()
aximg = ax.matshow(dat)

cb = fig.colorbar(aximg, ax=ax)
cb.set_label('foobar', rotation=270) #270度回転

plt.show()
もっと複雑なことをする
colorbar.set_label()は、実際には、colorbarのaxプロパティに対してset_ylabel()しています。
colorbar.ax.set_ylabel('foobar')
そのため、axes.set_ylabel()でできることは、colorbar.set_label()でもできますので、axes.set_ylabel()のドキュメントを参照してみてください。
axes.set_ylabel()には、text.Textプロパティをパラメータとして渡せますので、このドキュメントも参照してみてください。
例
label == ylabelだということはxlabelはどこにあるのか?
import matplotlib.pyplot as plt

dat = [[1,2,3,4,],
       [5,6,7,8,],
       [9,10,11,12,],
       [13,14,15,16,],]
fig, ax = plt.subplots()
aximg = ax.matshow(dat)

cb = fig.colorbar(aximg, ax=ax)
cb.ax.set_xlabel('cb_xlabel')

plt.show()
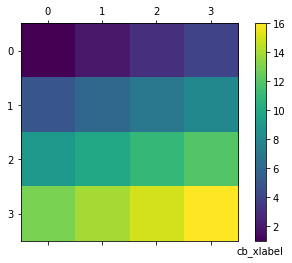
colorbarのxlabelはここにいました。
まとめ
matplotlib colorbarのlabelのさまざまな扱い方について紹介しました。参考になりましたら幸いです。
colorbar()ドキュメント日本語訳や、他のFAQもあわせて参考にしてみてくださいね。
- Figure.colorbar() / pyplot.colorbar() – matplotlibドキュメント日本語訳
- colorbar.ColorbarBaseクラス – matplotlibドキュメント日本語訳
- matplotlibのcolorbarを図と同じサイズにする方法。
以上、matplotlib colorbarのlabelの扱い方。でした。